Grokking Big Unfamiliar Codebases
There are plenty of reasons you might find yourself in a big unfamiliar codebase. You might have just started a new position. You might be doing technical due diligence on a possible acquisition or contract with an external company. You might be evaluating a third party framework or engine. Regardless of how you got there, learning to navigate unfamiliar code effectively is a useful skill that is seldom taught or discussed. Having evaluated and worked in many (sometimes wildly different) codebases over the years, I’ve developed a personal process for understanding new code that I wanted to share here. This advice is obviously somewhat personal, so should be read through the lens of a game engine programmer (who largely does rendering-esque work), but while the content here is geared mainly towards understanding large codebases, I suspect many of these tips will generalize to smaller codebases or codebases in other domains as well.
General mindset
There are a few critical guidelines that I think make sense throughout the process of exploring a new codebase. In no particular order:
- Think critically (without being critical, yet!).
- Be comfortable treating certain systems or subcomponents as “black boxes” until you are ready to revisit them later.
- Rely on documentation where possible, but don’t blindly trust it.
- Lean on tools liberally (debuggers, profilers, custom tools, built-in tools).
- If help is available, don’t be afraid to ask if you get stuck, ideally with some context on what you were trying to understand, and what was tried already.
- Let your instincts guide you if you think something feels much more difficult than you’d expect, drawing from prior experience as necessary.
- On the flipside, exercise judgement to identify key areas where what is observed differs from what your experience would lead you to expect.
What this boils down to is that it’s important to maintain an active mindset rather than a passive one. Equipped with an active mindset, you are in the driver seat. You form hypotheses and then seek to prove or disprove them. You compose guiding questions and then probe to answer them. You probe for strengths and weaknesses of a presented solution and then work backwards to understand why an approach was taken. At the end of an active learning session, it’s generally clear what was accomplished, and how to resume study at the next session.
In contrast, a passive mindset is a fairly unproductive one. As opposed to a targeted and intentional path through uncharted territory, I find that without actively maintained goals and subgoals, my time is spent meandering. After a few hours in this state, it’s not always easy to understand what was accomplished in that time, or where to even pick up when resuming.
High-level goal setting
Before beginning your journey in an new codebase, it’s important to clarify what it is you’re trying to accomplish. In my case, I typically am doing one of several tasks:
- Auditing a codebase for performance concerns and general code quality
- Learning a new codebase that will be my “home” for months to years as part of a new role
- Understanding a specific facet of the codebase with the intention to extend or modify it for a client or employer
While identifying a goal or two it isn’t hard to do, once you dive into things it can be easy to get side-tracked and overwhelemed, especially when the codebase in question is many millions of source-lines-of-code (SLOC) in weight. This goal can change over the course of your engagement with any codebase, and it’s possible to have many goals in the docket. That said, even if you might have multiple objectives in mind, I highly recommend having a narrow set of goals active at any one time in order to maintain your focus.
Build and run, debugger and profiler in tow
Regardless of what your high level goals are, you need to be absolutely confident in the ability to:
- Compile the code
- Make changes to the codebase (source/header edits, adding new source files, etc.)
- Observe the code running in a debugger
- Observe the code running in a profiler (possibly on more than one platform if needed)
This means that, at a minimum, the first order of business is a high level understanding of the codebase’s build system.
In some cases, this is a custom build system (e.g. UnrealBuildTool), and in others, it may be a CMake or Makefile based setup, or something else entirely.
At this point, I make sure to get a frame capture of a representative frame (this part is obviously game or game engine specific). Ideally, the frame capture is instrumented so you can see high level markers placed to indicate, e.g., where physics sim is running, or where rendering starts. You will need these anchor points at all times, so I will typically take the frame capture at least once and basically leave it open at all times. Finding the markers is usually as easy as a textual search of the marker name. This avoids the code-start problem of “where do I set my breakpoint” since you will always at least have these markers as a starting point for your search.
It stands to reason, by the way, that understanding your tools pays for itself many times over. In my field, those tools are Visual Studio, RenderDoc, PIX, VTune, RGP, RGA, Superluminal, NSight, Aftermath, and a whole host of other tools depending on the platform I am working on. The supporting tools and frameworks matter too. Git, GitHub, GitLab, CMake, Clang, ASAN, etc. are all too ubiquitous in my line of work to ignore for too long. I don’t have to like them, but having more than a cursory understanding of how to operate within these tools and toolchains gives me a leg up in getting onboarded.
Asking the right questions and getting answers
With a goal in mind, I like having a few active questions in mind at any moment. For example, suppose I am trying to understand how memory is managed by a hypothetical renderer. The candidate questions I’d have in mind are:
- At a high level, how is memory versioned from frame to frame on the CPU and the GPU?
- How are CPU and GPU writes synchronized/fenced?
- What threads are involved?
- What suballocation schemes are used for buffer and texture memory?
- How are UMAs and discrete memory architectures handled differently?
- etc.
The specific substance of the questions isn’t that important, but the point is that I might have several dozen of these questions on a given topic. From there, I pare that set down to one or maybe two targeted questions. At this point, using the tools mentioned above, I can start making specific probes to answer the questions.
Suppose I’m trying to learn how CPU and GPU memory is synchronized. I know that I am looking for:
- Waits on a fence of some sort (depending on RHI backend)
- Some form of write-combined or readback memory, depending on whether I’m investigating the upload or readback case
As a result, I know that for a specific backend (D3D12 in this example), I can identify all locations where ID3D12Fence::SetEventOnCompletion and ID3D12Fence::Signal is invoked, and set breakpoints accordingly.
Working backwards from each unique callstack, I can work out the family of code paths that result in events that pertain to the GPU’s DMA engine. I may need to filter out “false positives” (uses of those APIs related to
non-memory related synchronization), but the search will quickly narrow.
To generalize the above example, the basic idea is to lift from a low level abstraction to a high level one.
Use what you know about the platforms, underlying framework, or 3rd party APIs to start your search and work bottom up to learn the codebase’s higher level abstractions.
Candidate breakpoints include platform APIs (e.g. CreateFile, CreateThread, vkCreateBuffer, etc.), APIs of known dependencies related to your search (e.g. ASIO, Unreal engine APIs, protocol buffers, etc.), or
functions that showed up directly in your frame capture.
Now suppose you have a bunch of call stacks. You have the beginnings of a high level grasp of the execution flow of the program. The next order of business is to transition that understanding from execution to data. How are objects modeled? How are they stored? Who maintains what and how are lifetimes controlled? After identifying useful representative callstacks (this is the bottom up approach), the next thing to do is approach the codebase top down by studying the data structures themselves and understanding why and how a given callstack was formed.
After going top-down, or from execution to data, you may find other cases where you need to go bottom-up again, or identify new execution flows you want to examine. This flow of study is extremely cyclical, and I find I’m never in a specific mode of thinking for too long. However, it’s generally helpful to understand that this cycle is happening and will repeat. Transitioning modes (i.e. execution to data, data to execution, bottom-up, top-down) is a great way to get “unstuck” and explore new ideas. The aggregation of the learning accumulated across all these cycles is what forms the basis of your intuition about how a codebase operates as a whole.
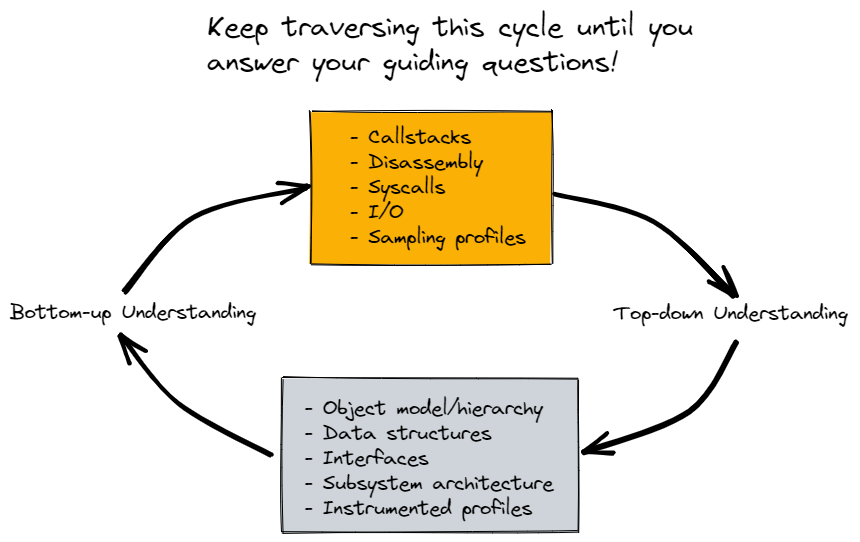
In the diagram above, you generally are trying to fill in details about the bottom box, using your experience with the top box as a guide to seed investigation. As you progress, you often transition back up again as discussed before to get a new angle on how things in the bottom box works. You can imagine this diagram being replicated for every system in the codebase you are learning, and sometimes you need to make progress in one system before you revisit a one that was previously opaque.
Document and verify
Taking notes is non-negotiable for me, not strictly as a memory aid, but as a means to communicate findings and verify them later. No matter how hard you try, navigating new codebases is inherently messy, and mistakes will be made. Perhaps you compiled the codebase without a specific setting that would change the behavior in an atypical way? Perhaps you inadvertently tested against legacy content and analyzed a defunkt codepath? Perhaps you simply made an error when reading code over the course of many hours of analysis?
Ultimately, there are plenty of reasons why we can go astray, in spite of our best efforts, and we should simply assume mistakes as an inevitability. Anticipating these mistakes then, I’ve found it’s always useful to compile a set of formatted notes to present to peers if possible. The general format is a few paragraphs on how I think something works, some things I noticed, and outstanding questions I might have. Even if I get it completely right, this process is often useful. On occasion, peers I’ve presented information like this to are surprised (“oh, we do what?”). On other occasions, peers themselves needed a refresher on a system. Of course, this feedback often catches mistakes as well. The point though is to create a feedback loop so that we aren’t learning in a vacuum.
Summary
If you find yourself in front of a large codebase and don’t know where to start, hopefully this is helpful to you. Admittedly, experience can play a big factor. It’s a lot easier to understand what’s there if you know what you’re looking for! Absent experience though, I would suggest simply asking for help in getting started in your independent exploration. Even as a junior engineer, it should be possible to glean what’s there, maybe with some initial assistance on getting a useful frame capture, or some representative breakpoints to start with.
Paramount though, is simply having an inquisitive and active mindset. Learning and evaluating code isn’t quite the same thing as writing code, but it’s an unquestionably useful skill for all software engineers to have.